S&P 500 Index
The S&P 500 Index, the most widely used benchmark to track US large cap equity performance, has significantly evolved over the last few decades, creating both risks and opportunities for investors. The companies in the Index currently have an aggregate stock market value of $55 trillion, which represents approximately 82% of the total market value of all US public companies. Many investors have been historically attracted to this index because of its broad diversification across sectors, industries, and individual companies. However, while this index is comprised of 500 of the largest companies in the US, it is a market-weighted index which means that each constituent’s weight within the Index represents the equity market value of the constituent relative to the aggregate market value of all 500 companies within the Index. Because the Index is market-weighted and the largest stocks within it have performed so well in recent years, the Index has become far less diversified than it has been historically.
Top 10 Companies
As of August 31, 2025, the ten largest stocks within the Index represented 39% of the entire market value, and the largest company, Nvidia, alone represented approximately 8% of the Index. In comparison, the ten largest companies in 2015 represented just 18% of the Index, and the largest company, Apple, represented approximately 3% of the Index.
As shown in the tables below, the concentration among the top ten companies and the weight of the largest company within the Index were similarly lower twenty and thirty years ago relative to the present. Thus, the Index is far more concentrated among the largest companies today than it has been at any point in its recent history.
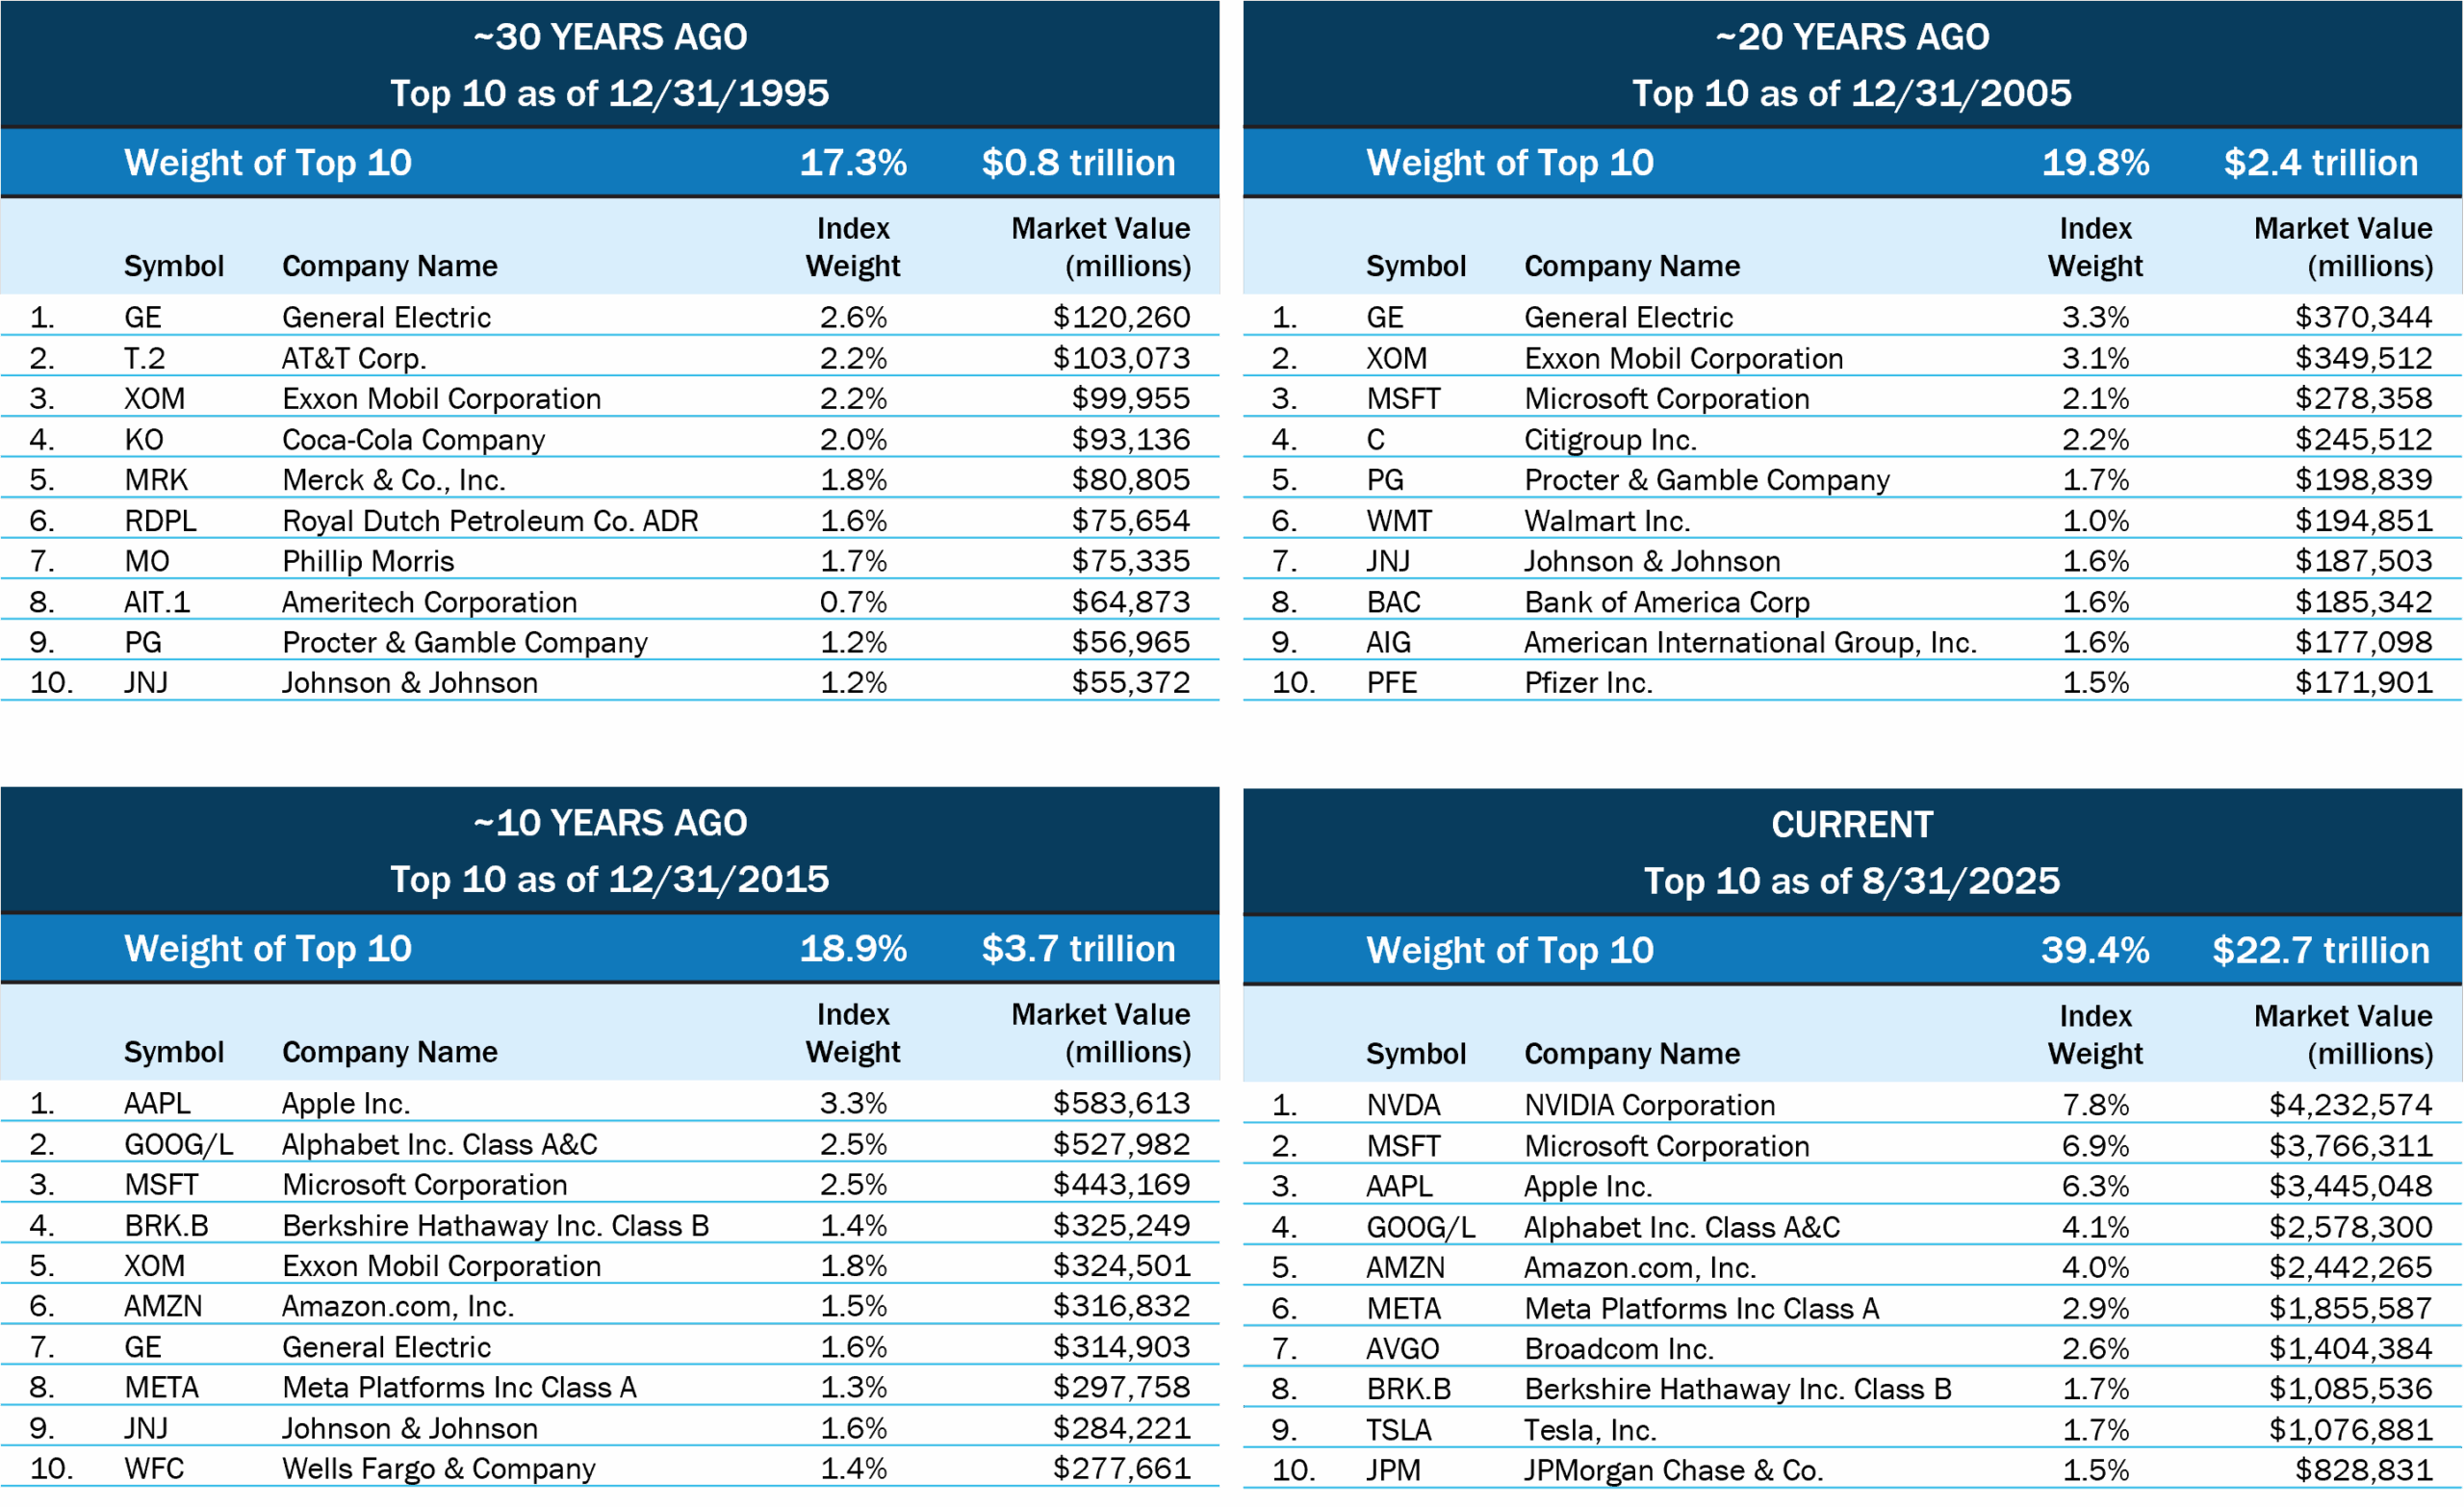
The information shown represents the top ten constituents of the S&P 500 Index as of the dates indicated, based on market capitalization and index weightings. Index constituents and their weights change over time. In situations where a company has multiple share classes of stock included in the Index, those Index weights have been combined.
One might also observe that the largest companies within the Index have changed over time. Only six of the current top ten companies in the Index were on the list ten years ago; and only one of them (Microsoft) was on the list twenty years ago. None of them were on the list thirty years ago. There are several reasons that explain this dynamic, including the challenges in maintaining durable competitive advantages over the long term, industry cycles (up or down), the explosive growth and proliferation of technology-oriented businesses in recent years, and changes in equity valuations. Regardless, it is likely that the top ten companies in the Index will be different a decade from now.
Industry Concentration
Industry concentration is another interesting consideration. Technology-oriented stocks1 currently represent 44% of the Index vs. 26% ten years ago and 15% twenty years ago. The increase in weight to the two sectors most directly leveraged to technology — Information Technology (IT) and Communication Services (within which Alphabet and Meta are classified) — has come at the expense of other sectors that have not experienced commensurate growth and valuation expansion. In fact, currently the two largest companies within the Index, Nvidia and Microsoft, represent a similar weight in the Index (14%) as the aggregate weight of five of the eleven sectors within the Index: Consumer Staples, Energy, Materials, Real Estate, and Utilities (15%). In other words, these five sectors account for 150 of the 500 companies in the Index but have nearly the same weight in the Index as just two stocks!
1 Defined as the S&P 500 Index’s information technology sector in addition to Alphabet, Amazon, and META.
Industry Leadership
Over the last several decades, industry leadership within the Index has rotated in response to market conditions, economic cycles, industry trends, momentum, and importantly, expectations for future growth. The following examples illustrate this point.
Near the peak of the dot-com bubble on December 31, 1999, the IT sector represented 38% of the Index. Following the dot-com crash, the IT sector’s weight declined sharply, to just 14% by December 31, 2002, as former highfliers underperformed the rest of the Index by a wide margin. Conversely, the Financials sector weight increased from 11% on December 31, 1999, to nearly 25% by the end of August 2008 at the precipice of the Great Financial Crisis.
In the spring of 2008, the Energy and Materials sectors had a combined weight within the Index of approximately 20%, as China’s seemingly insatiable demand for energy and materials to support its booming economic growth boosted the value of stocks in these sectors; yet, China’s economic growth slowed considerably in the years that followed, thus failing to meet investor expectations. Energy and Materials stocks declined with the moderating expectations for Chinese demand. As a result, the combined weight of these two sectors in the Index now stands at just 5%!
Concentration Risks & Opportunities
The current concentration among the largest companies and within the technology industry, broadly speaking, presents both risks and opportunities. The increase in the Index’s exposure to technology-oriented companies is largely attributable to the emergence of several leading technology companies that have produced outstanding earnings and prodigious free cash flow. This group includes the six largest companies in the Index: Alphabet, Amazon, Apple, Meta, Microsoft, and Nvidia. These six companies accounted for over half of the Index’s return from December 31, 2022 through June 30, 2025.
While the financial successes of these companies over the last decade have been impressive, some of these companies have also benefitted from the expansion in their equity valuations, thus reflecting heightened expectations that their future growth will remain well above average. If these companies can continue to produce excellent earnings and free cash flow, then they are likely to collectively support the Index and its continued climb to record highs. However, if growth should decelerate for whatever reason and fail to match investor expectations, then valuations would likely contract, and Index returns could be subpar.
Index Valuation
The total return that investors earn on equities — and by extension the S&P 500 Index — consists of three components: dividends paid by the companies, earnings per share (EPS) growth, and the change in valuation on the underlying EPS. Over the long term, the most significant component of total return is EPS growth. However, over shorter periods of time, changes in equity valuations can be a meaningful contributor to, or detractor from, total returns. For example, the Index has returned approximately 90% since September 30, 2022, and while the underlying growth in S&P 500 company earnings has been solid, the willingness of investors to pay higher multiples on their equities has been a major driver of this return. As a result, the overall valuation of the S&P 500 Index presently stands near an all-time high at roughly 27x trailing EPS — a significant increase from the 17x P/E multiple on September 30, 2022. This valuation reflects continued optimism that large companies, and particularly the largest companies within the Index, will continue to produce above-average earnings growth for years to come. Yet, over the last forty years, the S&P 500 Index’s valuation has only been higher on one occasion (excluding recessionary periods in which EPS are depressed), which was in late 1999/early 2000. Unfortunately, returns on the S&P 500 Index proved very disappointing over the next decade as the annualized return on the S&P 500 Index for the 10-year period from December 31, 1999 to December 31, 2009 was actually negative, at -1.0%!
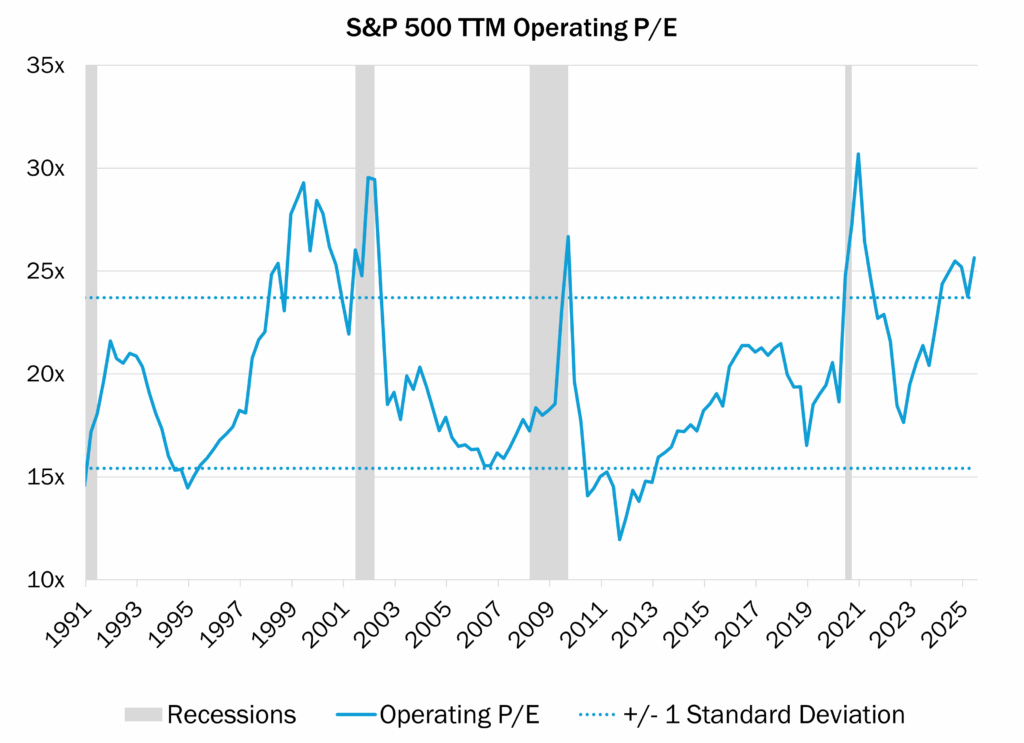
The chart illustrates the S&P 500 Index’s trailing twelve-month price-to-earnings ratio (TTM Operating P/E) for the indicated time period, measured quarterly. Operating P/E is based on aggregate reported Index operating earnings and the end-of-period Index value. Recessionary periods are shaded for reference.
Many investors have pointed to the current Index valuation as a key risk to investors, noting that this valuation level is unsustainable, while others have argued that the increased weight to technology-oriented companies within the Index along with record profit margins and free cash flows justifies the current valuation of the Index. Time will tell who wins this debate, but over the last few years, the optimists have reaped the benefits.
Final Thoughts
Given these considerations, should investors ignore the record valuation, industry concentration, and company concentration among the top constituents of the Index? What if these mega-capitalization, technology-oriented companies continue to produce exceptional EPS and free cash flow and become even larger concentrations within the Index? Should investors abandon long-standing investment tenets, such as diversification and valuation, to fully participate in the financial successes of this narrow group of market leaders? Or, since these concentration risks are unique to the large cap index, should investors consider other segments of the equity universe, e.g., small cap or international stocks? These are the considerations that weigh heavily on the minds of professional investors who are entrusted with managing investments for clients in this unique market environment.
At Boston Trust Walden, we continue to focus our efforts on constructing well-diversified portfolios of higher quality companies with sustainable business models whose stocks are trading at reasonable valuations. We believe this approach will continue to add value over full market cycles in the future, just as it has in the past.