Tracking error and why we believe other metrics better highlight the relative “riskiness” of an investment strategy
by Nick Caldwell, CFA, Senior Manager, Institutional Markets
December 28, 2022

A standard inquiry from institutional investors analyzing the ability of a strategy to outperform is the level of historical tracking error and whether the manager sets a specific tracking error target. In this blog post, we seek to define tracking error and elucidate why we believe other metrics may better highlight how we think about the “riskiness” of a strategy relative to the index.
Tracking error (specifically ex-post tracking error) can be a useful metric to gauge how “actively” an investment strategy is managed. It measures the standard deviation, or volatility, of relative returns when comparing a strategy to its respective benchmark. Mathematically, ex-post tracking error is expressed as:
![]()
Ex ante, tracking error has utility in quantitative modeling to determine the expected alpha, or risk-adjusted excess return, that a manager may generate over a specific period. Ex post, investors can observe the variability in experienced relative returns and gauge whether a manager has executed their investment process in a manner consistent with expectations.
Why Does It Matter?
Passive investment strategies tend to be the most heavily scrutinized by using tracking error. The term “error” itself is quite literal in this sense – a passive strategy is expected to replicate the returns of an index as closely as possible, and any deviation from those returns is suboptimal. In other words, a passive strategy should exhibit minimal, if any, tracking error to fulfill its mandate.
For actively managed strategies, depending on the investor’s objectives, higher tracking error may be desirable or even a requirement for a manager to achieve their stated objectives for return and risk. Provided that the investment thesis is sound, disciplined, and repeatable, investors with long time horizons should tolerate higher tracking error, given the opportunity to generate higher alpha in exchange for higher deviation in volatility.
Boston Trust Walden and Tracking Error
Historically, Boston Trust Walden’s equity strategies have exhibited between 4% – 7% tracking error on an annualized basis over market cycles. However, we do not manage our strategies to a specific tracking error target or range. Rather, it is simply an outcome of our approach that focuses on what we identify as higher quality companies trading at reasonable prices. Suffice it to say, our investment style means our strategies will exhibit a meaningfully different set of financial characteristics than the index as well as a distinct performance pattern. It also means that our tracking error is not likely to be constant across a market cycle and will depend greatly on how the overall stock market is performing. In fact, the Boston Trust Walden Small Cap strategy ex-post tracking error has historically been higher in bear markets (8.4% annualized) and lower in bull markets (5.9%).1
While we have confidence that our investment style is able to produce superior risk-adjusted performance over full market cycles, we acknowledge our strategies will also exhibit higher variability – and tracking error – of results over shorter time periods. The market’s reaction to the COVID-19 pandemic is a helpful case study to illustrate this phenomenon. The market experience for the two-year period ending December 31, 2021 can be broken down into three distinct periods: a sharp initial market correction, subsequent rapid recovery, and normalization. We provide returns for the Boston Trust Walden Small Cap strategy and the Russell 2000® for those periods below:
Pandemic Case Study
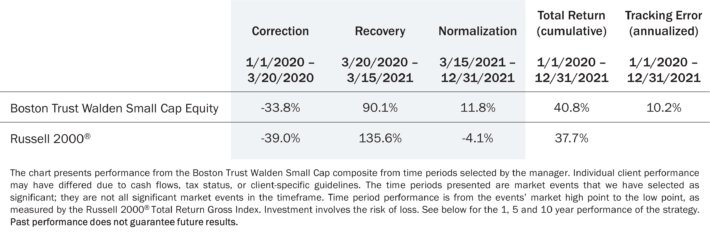
In each market environment, and over the full period, our strategy performed as we would generally expect – participating to the upside while protecting on the downside, resulting in full period outperformance. (The standard deviation of the strategy’s returns during this entire period was 21.3% versus 26.5% for the Russell 2000®). We believe a comparison of strategy up capture and down capture is a better indicator of whether the strategy is achieving its risk and return objectives. However, given the initial shock of the pandemic and the unprecedented fiscal and monetary responses by the government, overall market volatility increased dramatically.
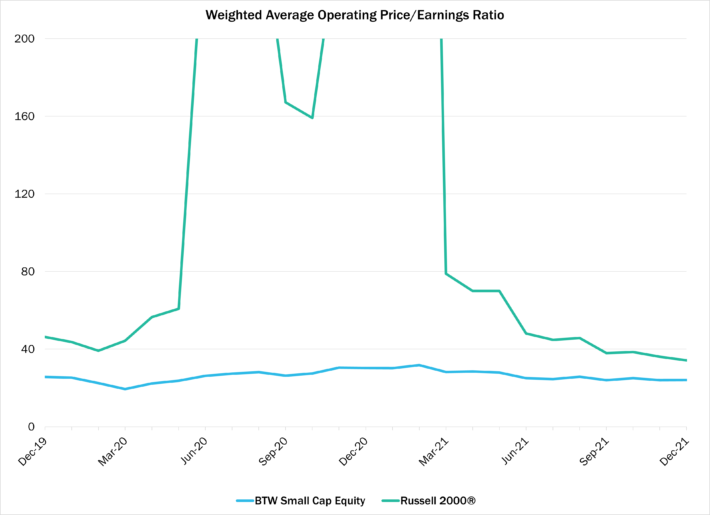
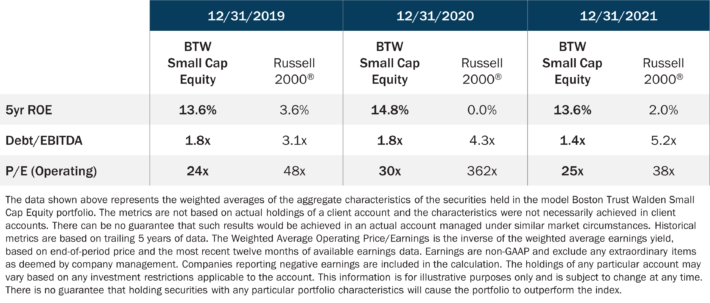
As noted in the above chart, the Boston Trust Walden Small Cap strategy generated 10.2% annualized tracking error over this period — well above historical levels, despite maintaining an active share consistent with levels when strategy tracking error was closer to 5%. However, we believe this figure can be misleading for a few reasons. First, our objective is two-fold in that we aim to outperform the benchmark while generating less risk, as measured by volatility of returns — and this period was no exception. This is a testament to the stability of the companies in which we invest. Second, the fundamental and valuation profile of our strategy remained steadier than that of the index, which ties back to market volatility having an outsized effect on tracking error. Below is a series of snapshots comparing various metrics:
Portfolio Characteristics
The institutional clients with whom we work are responsible for the financial well-being of their plan’s participants, and beneficiaries want assurance that their investment managers will perform as expected. We can certainly empathize with this objective, and tracking error is one way to evaluate manager effectiveness. However, we would argue that a substantial portion of tracking error is beyond the manager’s control, particularly for managers like Boston Trust Walden that emphasize consistency in long-term fundamentals by owning higher quality, less risky stocks in all market environments.
1Tracking error is calculated as the standard deviation of the variation in quarterly returns for calendar months during the designated periods. Past performance does not guarantee future results.
PRESENTATION DISCLOSURE
Past performance is not indicative of future results. Investment involves the risk of loss of principal. Performance results presented are from the Boston Trust Walden Small Cap Equity Composite. Individual client performance may have differed due to cash flows, tax status, or client-specific guidelines. Nothing herein should be construed as tax or legal advice. Always consult your financial professional prior to any investment. This document should not be construed as a recommendation to buy, sell, or hold any particular security. This document may include forward-looking statements, which are based upon our current opinions, expectations, and projections. We undertake no obligation to update or revise any forward-looking statements. Actual results could differ materially from those anticipated in the forward-looking statements. Please note the specific disclosures above with respect to model portfolio characteristics.
About Boston Trust Walden Company
We are an independent, employee-owned firm providing investment management services to institutional investors and private wealth clients.