The equity market and GDP: Less linked than you might think
by Nathaniel Riley, CFA, Senior Strategist
January 5, 2021

Is the equity market a reflection of the economy? Financial market commentators frequently cite predictions for economic growth and imply that the equity market should behave in roughly the same manner. Although these two measures may be related in certain respects, there are many reasons why they can, and often do, diverge.
In this article we will review why equity returns may have less in common with Gross Domestic Product (GDP) growth rates than many believe. We will then turn to the historical record to evaluate their empirical relationship over time.
What Are We Measuring?
In theory, the value of the stock market is equal to the present value of expected future cash flows available to shareholders of publicly traded companies.1 This value can fluctuate wildly at times, and depends on ever-shifting expectations for corporate profitability, corporate investment opportunities, and the rate used by investors to discount future cash flows, which in turn depends on expectations for the future level of interest rates and investors’ risk appetite. Many investors claim the market is “forward looking” because current prices depend so much on what investors think will happen in the future.
In contrast, GDP is a measure of total output over a defined period of time—for example a year or a quarter. The value of a country’s GDP can be calculated in a few ways. For our purposes here, using a country’s aggregate income to calculate total GDP2 can help us better understand the link between GDP and equity values. If aggregate income rises, equity values may also increase if their profits rise too.3
There are many caveats to this assumption, however, including:
- Equity investors care about income and cash flows from all regions in which a company operates, not just its home country, so domestic GDP growth is only part of the picture if an equity market is dominated by multinational companies.
- GDP includes income that flows both to capital and to labor, and the split between these two can shift over time. Equity investors are capital owners, so equity valuations will depend primarily on expected income flowing to capital.
- When citing expected GDP growth, many commentators are looking only at the next quarter or next year, while equity investors care about profitability many years into the future. This distinction is especially important when interest rates are low, and the present value of profits expected years out makes up a significant portion of the market’s value.
- The dynamic between GDP growth, equity values, and interest rates is complex, but can lead to surprising outcomes. For example, when GDP growth is low or negative, the Federal Reserve may lower interest rates to stimulate the economy, which, all else equal, can rapidly boost the present value of future cash flows (and therefore the value of stocks). The opposite is also true; when GDP growth is high the Fed may raise rates, ultimately reducing the value of equities.
Composition of the Equity Market and of GDP
We can get a more granular and more tangible comparison of GDP and equity market values by looking at what is included in each. If the sector make-up of the equity market reflects that of the country’s GDP, we might assume that, despite the caveats above, the two will generally move in tandem. But Figure 1 shows the composition of US GDP is quite different from that of the US equity market.4 The portion of total value added in certain sectors is far higher or lower than the respective weights in the equity market.5
Figure 1: Composition of Equity Market and GDP
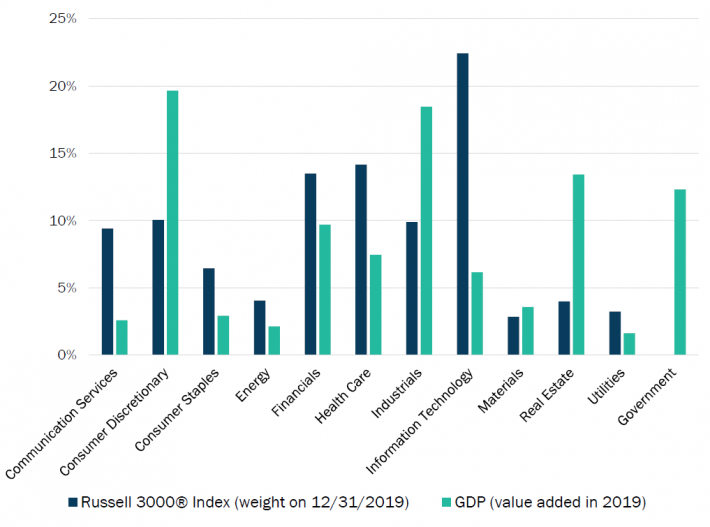
Sources: BEA, Bloomberg
The discrepancies between GDP sector weights and equity sector weight are rooted in the fundamental differences of the two measures, as outlined above. For example, much of the value added in the consumer discretionary sector is done by labor, and the compensation of employees makes up a larger portion of the total. This means there is less return flowing to capital—the domain of equity investors—in this sector relative to others, so its equity market weight is smaller than its GDP weight.
In contrast, global technology companies dominate the market value of that sector; they conduct much of their business, and collect a substantial portion of their profits, outside of the US. These profits are very relevant to the valuation of these businesses and have led, in part, to the tech sector’s significant share of the US equity market. But US GDP figures only capture these firms’ exports of goods or services that originate within the US, which is only a fraction of the total foreign operations of US-listed tech firms.6
Historical Relationship
Rather than just pondering whether we should expect GDP and equity growth to be linked, we can use historical data to observe whether they have been correlated in the past. Figure 2 shows the relationship between US GDP and the Russell 3000® Index from 1979 through 2019. Each point on the chart represents the annual growth (or decline) of GDP in that year (x-axis) and Russell 3000® Index return in that year (y-axis). If there was a strong correlation between these two variables, we would expect to see a pattern resembling an upward-sloping line. But instead what we see is a scatterplot with little discernible relationship, suggesting that GDP growth has little contemporaneous effect on equity prices.
Figure 2: GDP and Equity Market Performance, 1979 - 2019
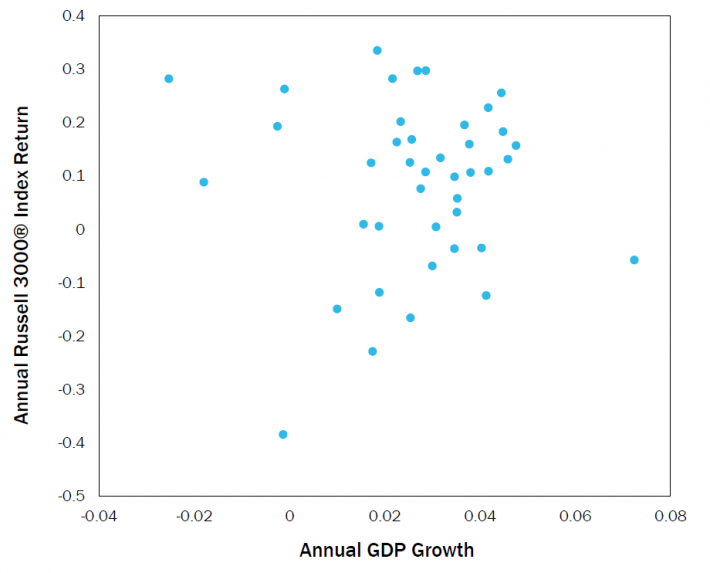
Sources: BEA, Bloomberg
Despite the intuitive notion that GDP and equity values should be closely linked, more often than not this relationship is, in fact, fairly weak. There are significant fundamental differences in what they are measuring, and the historical relationship bears this out. At Boston Trust Walden we use GDP data to provide an overview of the economic landscape, but we also use a variety of other, more targeted economic data to evaluate the forces affecting corporate prospects and investor behavior. This analysis, used in conjunction with our bottom-up research on individual companies, aids our understanding of the prospects for equity sectors and markets.
Endnotes
1While the total value of the stock market contains the value of all publicly traded companies, performance is usually measured with indices that contain a subset of those companies. The performance of indices like the S&P 500, Russell 1000®, or Russell 3000®, which contain a broad selection of the largest companies in the market, are generally a reasonable proxy for the performance of the full market.
2There are three ways to calculate a country’s GDP, all of which should lead to the same amount. The most well-known method of GDP calculation in the US is based on the value of final sales; alternatively, it can be measured as the total value added by labor and capital within the country’s economy, or it can be measured as the total income paid to workers and to capital owners. The Bureau of Economic Analysis (BEA) calculates US GDP in all three ways. The BEA table (NIPA table 1.10) showing GDP calculation by income can be found here.
3Using these guidelines for how the stock market is valued and how GDP is calculated, we can compare what the respective growth rates of either measure indicate: A rise of the equity market by 5% over the course of a year indicates that investors, in aggregate, believe the present value of future cash flows increased by 5% during that time. In contrast, a rise of GDP by 5% in a year means that actual, measured output increased that amount over the prior year. The increase in GDP is purely historical; it says nothing about what might happen in the future, though economists and investors may use the recent growth rate when forecasting future growth in economic activity and earnings.
4We use the Russell 3000® Index for analysis of stock market value and returns. This index includes large, mid, and small cap US stocks and is designed to capture roughly 98% of the total investable US stock market value.
5For analysis at the sector level the BEA uses the ‘valued added’ approach to GDP calculation, measuring the value companies within each sector create by transforming their raw materials into their finished products.
6There are many other reasons for the discrepancies between GDP and equity market weights of the consumer discretionary, technology, and other sectors beyond those cited in the text above. Examples include the fact that government is included in GDP but is not an equity market sector, certain sectors of the economy tend to have disproportionately more small firms or sole proprietorships that are not publicly traded, and valuation differences across sectors mean income levels do not translate to market values at the same rate in all sectors.
About Boston Trust Walden Company
We are an independent, employee-owned firm providing investment management services to institutional investors and private wealth clients.