Profit-makers vs. loss-makers: How company profitability impacts long-term investment returns
by Nick Caldwell, CFA
December 18, 2019

At Boston Trust Walden, our investment philosophy is rooted in the belief that portfolios of high quality companies will earn superior, risk-adjusted returns in the long run. In selecting portfolio holdings, we look for various markers of company quality, including high levels of historical profitability, stability, growth, and balance sheet strength (see our previous blog post on this subject). But sometimes “simpler is better” when illustrating the character of our investment discipline. For this reason, we regularly compare the investment results for profitable companies to those of unprofitable, or loss-making, ones.
Our preferred metric to characterize loss-makers is negative earnings before interest and taxes (“EBIT”). EBIT is a useful measure of consistent profitability and business quality because it is less subject than net earnings to one-time accounting effects, the quirks of tax accounting, and capital structure choices. We choose five years of EBIT history – certainly a period long enough for a successful business to generate a cumulative profit.
Using this metric, it might be hard to imagine unprofitable companies having any meaningful effect on index composition and performance. After all, wouldn’t it be reasonable to assume that a company that has generated losses for five years or longer is on its way to bankruptcy or at least irrelevance? This is not the case for many small cap equities, however. Based on our research, over the last ten years loss-makers have comprised approximately 16% of the Russell 2000® Index on average (by weight) – a cohort large enough to impact total index performance.
We have observed a persistent tendency among investors to favor riskier investments that are believed to have compelling growth prospects. There are several possible explanations for this behavior, but a critical one is surely the short-term oriented compensation structure common in the investment industry: portfolio manager and analyst performance is typically evaluated on 1- to 3-year results. When times are good and markets are rising, the easiest way to boost results (and earn outsized financial rewards) is to ignore risk, select the most speculative investments, and benefit from the rising tide. The short-term benefits can be compelling: valuations expand, momentum accelerates, and already expensive stocks further appreciate ahead of company fundamentals. We observed this phenomenon most recently from January 2012 to June 2015 when unprofitable companies significantly outperformed profitable ones.
Annualized Returns of Russell 2000® Profit- and Loss-Makers, January 1, 2012 through June 30, 2015
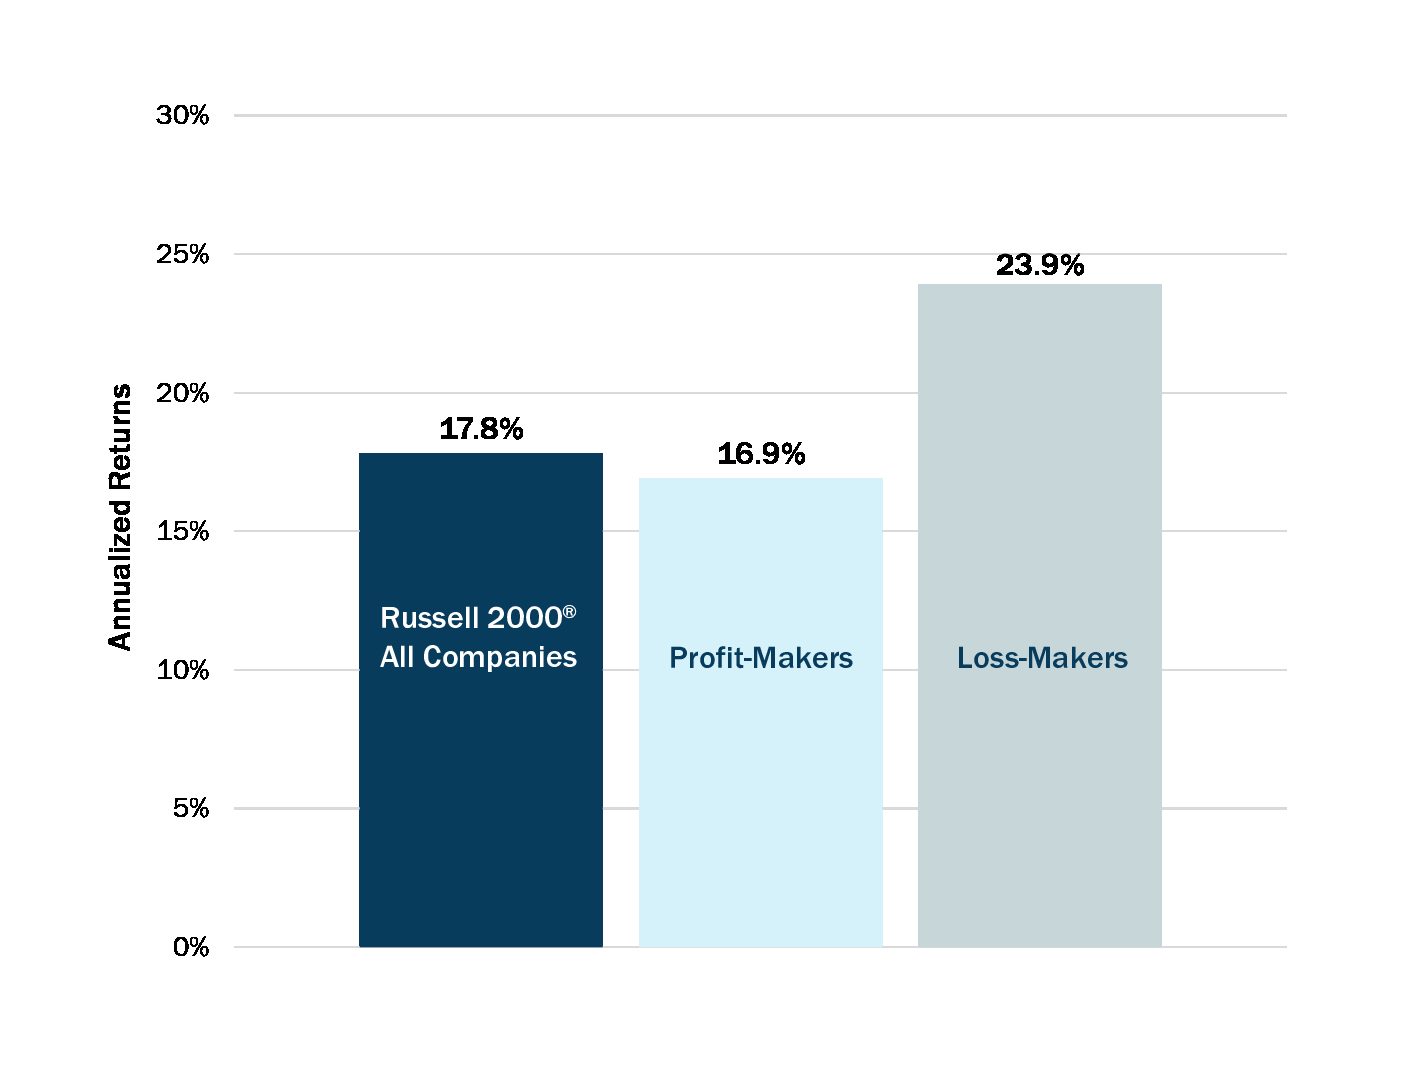
Source: Boston Trust Walden, FactSet, Russell
Since these companies do not generate earnings, attributing their outperformance to standard measures of business success makes little sense. In contrast, our analysis makes clear that valuation expansion is the real driver of performance. But how do you measure the valuation of companies with no earnings? We use the simplest measure: price-to-sales. The data reveals an extreme and rising bifurcation in the valuation of small capitalization stocks. Since the beginning of the current bull market in March 2009, the weighted median price-to-sales ratio for unprofitable companies climbed from 3.3x to 8.6x, whereas the same ratio for profitable companies climbed from 1.0x to 2.1x (as of September 2019). We believe this trajectory for loss-makers is unsustainable.
Price/Sales of Russell 2000® Profit- and Loss-Makers since 2008
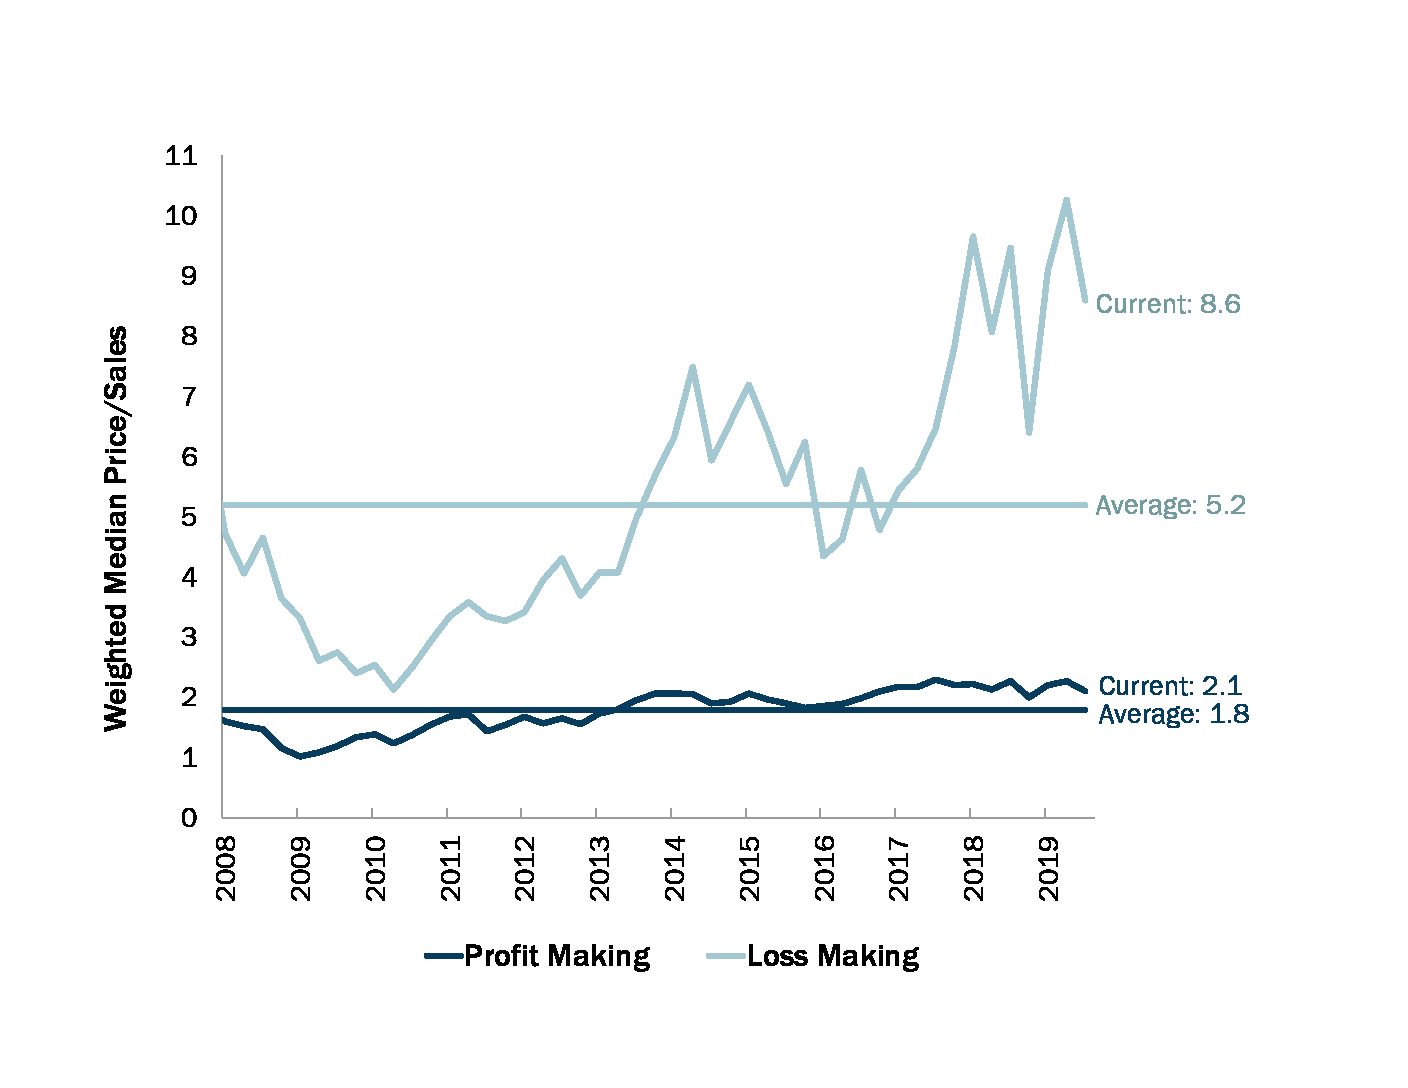
Source: Boston Trust Walden, FactSet, Russell
For long-term investors like our clients, we suggest a “full market cycle” – one that includes both strong bull markets and sustained bear markets, and those intermittent periods when risk appetite wanes – is a more meaningful time period for evaluating investment performance. According to the multi-decade data we have analyzed, higher quality companies generally outperform the broader index over a full market cycle, as well as during shorter periods of heightened volatility. Intuitively this makes sense: changes in valuation should be, in theory, mean-reverting and fundamentals (i.e., earnings) should ultimately drive total returns. This was the case from May 2007 to September 2019 (by our definition the current market cycle): profitable companies outperformed unprofitable ones by approximately 2.5% annualized.
Annualized Returns of Russell 2000® Profit- and Loss-Makers, May 31, 2007 through September 30, 2019
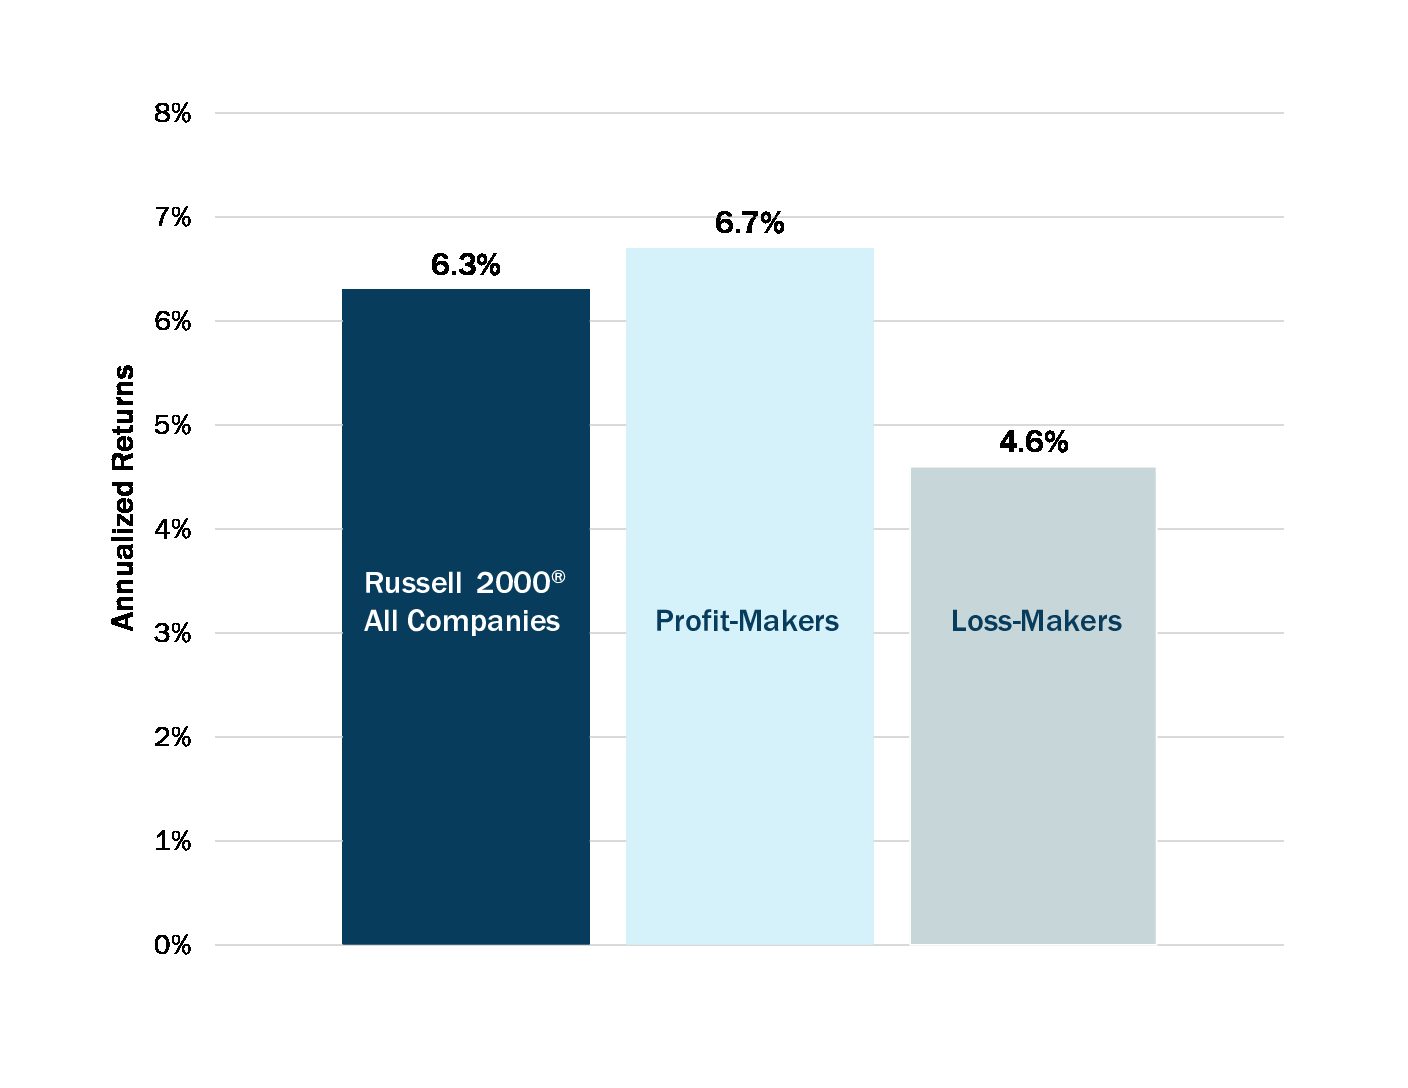
Source: Boston Trust Walden, FactSet, Russell
As investors (and humans), it is in our nature to chase the “next best thing,” but this tendency has not been rewarding over long time periods. In contrast, our approach has been to identify higher quality companies in all phases of a market cycle, acknowledging such companies may be temporarily out of favor when investors are driven more by greed than fear. For those who can withstand the inevitable periods of relative underperformance, the long-term benefits of a disciplined process that focuses on companies with consistent and superior profitability can be substantial.
Past performance does not guarantee future results. Information provided herein is not intended to be used as investment advice, an offer to purchase or sell the securities, or a solicitation or offer to sell investment advisory services. Boston Trust Walden Company, its staff, and affiliates (collectively “BTW”) do not provide tax, accounting, or legal advice. You should consult with your legal or tax advisor prior to taking any action relating to the information contained herein. Opinions expressed may be different from time to time than those presented by different authors or BTW. Data contained herein are derived from sources believed to be reliable at time of publication however, they may not be complete or accurate at all times and we undertake no, obligation to advise you of any changes or to provide an update.
About Boston Trust Walden Company
We are an independent, employee-owned firm providing investment management services to institutional investors and private wealth clients.